DISLIN Home Page
Welcome to the home page of the scientific data plotting software DISLIN.
DISLIN is a high-level plotting library for displaying data as curves, polar plots, bar graphs, pie charts, 3D-color plots, surfaces, contours and maps.
DISLIN is intended to be a powerful and easy to use software package for scientists and programmers. There are only a few graphics routines with a short parameter list needed to display the desired graphical output. A large variety of parameter setting routines can then be called to create individually customized graphics.
The software is available for several C, Fortran 77 and Fortran 90/95 compilers on the operating systems UNIX, Linux, FreeBSD, OpenVMS, Windows, Mac OSX and MS-DOS. DISLIN programs are very system-independent, they can be ported from one operating system to another without any changes.
For some operating systems, the programming languages Perl, Python, Java, Ruby and the C/C++ interpreter Ch are also supported by DISLIN. The DISLIN interpreter DISGCL is availble for all supported operating systems. See a complete list of the supported operating systems and compilers.
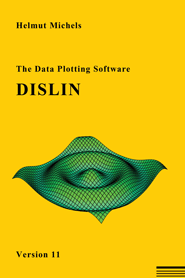
A short description of the DISLIN features is given in Overview while a detailed description is available in the online manual and in the alphabetical list of all DISLIN routines. The online manual can also be downloaded in HTML format as a compressed tar file. A printed book of DISLIN can be ordered here, or directly from the author. Last but not least a PowerPoint presentation of DISLIN is available in the file dislin.ppt.
DISLIN is free for non-commercial use. Licenses for commercial use, or for just supporting DISLIN, are available from this site.
The DISLIN software and manuals can be downloaded via HTML and from FTP servers.
