Slow appearance of sunspots challenges theory
Scientists find that sunspots rise to the surface much more slowly than predicted
Solar active regions consist of strongly magnetic sunspots and surrounding regions of more diffuse magnetic field. These regions are the origin of solar activity which controls space weather and causes beautiful phenomena such as aurora but in some cases also damage to satellites or power grids. Solar active regions are thought to be the result of magnetic flux concentrations - bundles of magnetic field lines - rising from deep in the solar interior and penetrating the surface. A team consisting of researchers from the Max Planck Institute for Solar System Research (MPS), The University of Göttingen, NorthWest Research Associates, and the High Altitude Observatory of the National Center for Atmospheric Research has now shown that these magnetic flux concentrations move upward through the solar interior at speeds of not more than about 150 m/s. This is much slower than predicted by the prevailing current model. For their study, which is published today in the journal Science Advances, they compared satellite observations and computer simulations.
A clear sign of a magnetic flux concentration penetrating the surface of the Sun are regions with magnetic fields of opposite polarity. These polarities are clearly visible on magnetic maps provided by the Helioseismic and Magnetic Imager (HMI) instrument onboard NASA’s Solar Dynamics Observatory (SDO). The researchers used these images to identify active regions and to determine the moment of their emergence.
, funded by the German Aerospace Center (DLR).")
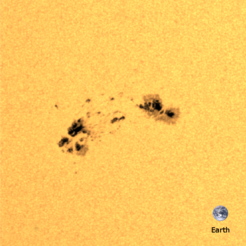
Credit: MPS. The HMI data were used courtesy of NASA/SDO and the HMI science team and processed at the German Data Center for SDO (GDC-SDO), funded by the German Aerospace Center (DLR).
Since its launch in 2010, SDO has provided an almost uninterrupted stream of data. “For our research we needed observations of a statistically significant number of active regions,” explains lead-author Aaron Birch from the MPS. “HMI is ideal for our purpose as it provides high-resolution images of the complete solar disc with essentially continuous coverage in time,” he adds. Because of the Sun’s activity minimum in 2010, during which active regions occur much less often than usual, the team had to collect observations for several years.
But HMI not only provides maps of magnetic fields but also images in the visible light of the solar surface. These data were essential for measuring horizontal flows around the identified active regions. The team measured the surface plasma flows associated with emerging active regions using two methods: They tracked the motion of the small-scale brightness patterns and they also measured the propagation of pressure waves.
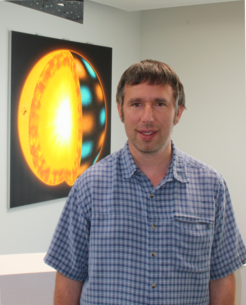
Credit: Matthias Rempel @ High Altitude Observatory of the National Center for Atmospheric Research. The National Center for Atmospheric Research is sponsored by the National Science Foundation. Computing time was provided by the NASA High-End Computing (HEC) Program through the NASA Advanced Supercomputing (NAS) Division at Ames Research Center under projects s1325 and s1326.
At the same time, co-author Matthias Rempel from the High Altitude Observatory in Boulder carried out computer simulations, run on NASA supercomputers, of magnetic flux concentrations rising through the solar interior and interacting with magnetoconvection – the turbulent motions of plasma – underneath the surface. This type of simulation is computationally expensive and has only recently become feasible. The simulations showed that the strength of the surface flows increases with the upward speed of the magnetic flux concentrations: material is pushed to the sides by the upward motion of the flux concentrations.
By comparing these computer simulations and the observations of surface flows, the team showed that magnetic flux concentrations cannot be rising more quickly than the local subsurface convective velocity, which is about 150 m/s at a depth of 20000 km below the surface. This is in contrast to the current best model for the emergence of active regions which predicts a rise speed of about 500 m/s at the same depth. “This result shows that the prevailing theoretical picture must be modified to include the effect of convection in the solar interior,” concludes Birch.

The lead author, Aaron Birch, is a scientist at the Max Planck Institute for Solar System Research and a member of the department “Solar and Stellar Interiors”. The SDO/HMI data were made available by the HMI Science Team to the German Data Center for SDO funded by the German Aerospace Center (DLR) and a part of the SpaceInn network funded by the European Union. The data processing was, in part, done using the workflow management system Pegasus funded by the National Science Foundation. Computing time for the project was provided by the NASA High-End Computing (HEC) Program through the NASA Advanced Supercomputing (NAS) Division at Ames Research Center. This work was in part supported by the NASA Heliophysics Division.