DISLIN Examples
 |
 |
 |
 |
| Demonstration of CURVE | Shading Patterns | 3-D Colour Plot | Map Plot |
 |
 |
 |
 |
| Polar Plots | Symbols | Interpolation Methods | Bar Graphs |
 |
 |
 |
 |
| Pie Charts | 3-D Bar Graph / 3-D Pie Chart | 3-D Bars | Surface Plot |
 |
 |
 |
 |
| Shaded Surface Plot | Contour Plot | Shaded Contour Plot | Surface/Contour Plot |
 |
 |
 |
|
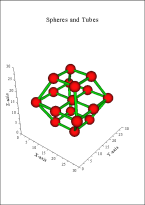
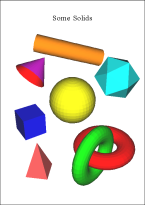
| Spheres and Tubes Plot | Some Solids | TeX Instructions | Web Example |